
You bought a stock when it was trending up. But you lost money. You scratch your head and think to yourself “Isn’t trend following about buying when the trend is up and selling when the trend reverses?” I was in your shoes.
If only trend following was this simple and straightforward! Over time, I have discovered 3 wonderful chart patterns which can help you to exploit the opportunities that trends bring.
What are these chart patterns? Flag, Pennant, and Wedge.
With the ability to recognize these 3 price patterns, you can advance towards your goal of financial security.
What’s The Cause Of The Flag, Pennant, And Wedge Patterns?
After sprinting, you will need a break before you can continue your next sprint. Similarly, prices tend to rest or retreat a little after a burst (uptrend and downtrend alike). This is due to profit taking from the market participants, resulting in the flag, pennant, and wedge patterns.
Spot It Right
Note the slight differences so that you can spot them correctly to profit.
#1 Flag

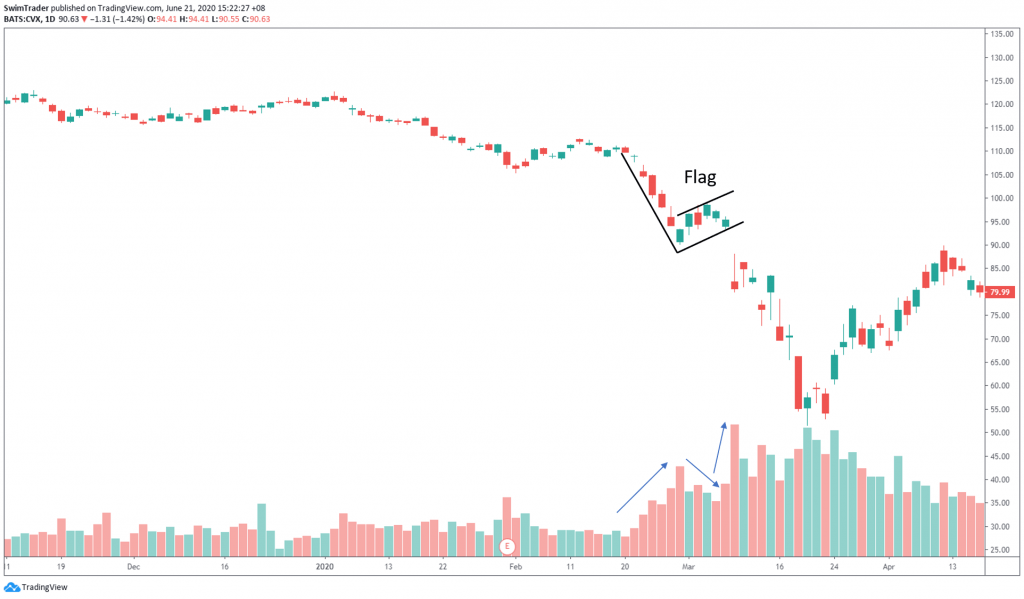
Characteristics:
- High volume before the flag forms
- Flag takes 4 days to 5 weeks to form (be wary if the flag takes longer to form)
- Volume decreases as the flag forms
- Volume increases when price breaks out of the flag
- 2 parallel lines which run opposite or horizontal to the main trend, hence its name, the flag
#2 Pennant
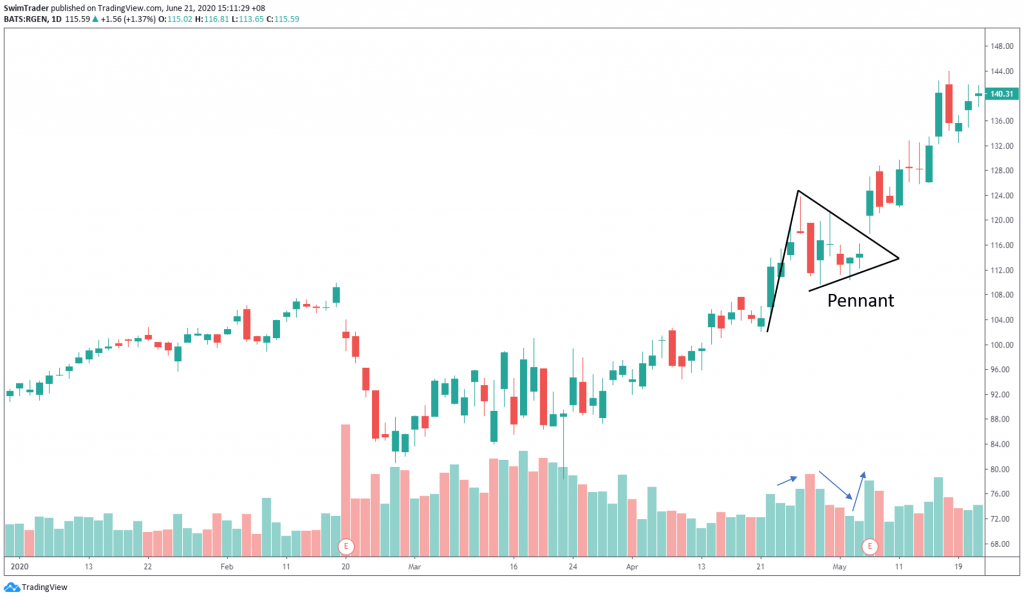
Characteristics:
- Volume characteristics similar to flag
- Pennant takes days to 2 weeks to form
- 2 converging lines pointing towards each other to form a triangle
- Pennant is formed in the opposite direction of the main trend
#3 Wedge

Characteristics:
- Volume characteristics similar to flag
- Wedge takes 2 to 8 weeks to form
- 2 converging lines pointing toward each other to form a triangle
- Wedge is formed in the opposite direction of the main trend
2 Subtle Differences Between A Pennant And A Wedge
The breakouts on pennants occur near the apex of the triangle. This may not be so for wedges.
The 2nd subtle difference is the time taken for the pattern to form. Pennants are usually formed in a matter of days while wedges take weeks to form.
Show Me The Money
So how can you exploit the opportunities presented by these 3 chart patterns? Watch the main trend and volume. Trade the breakout in the direction of the main trend.
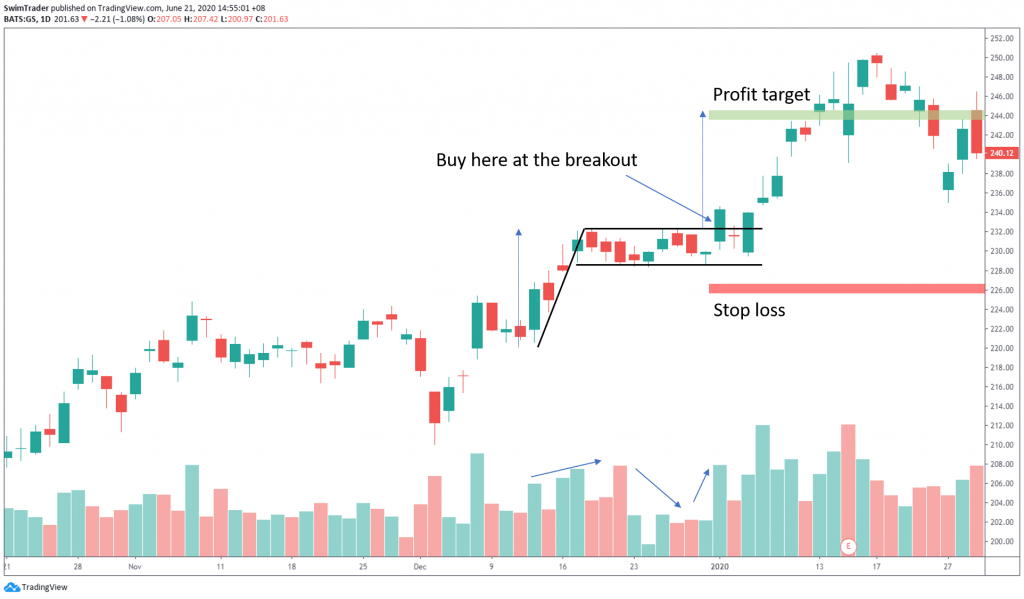
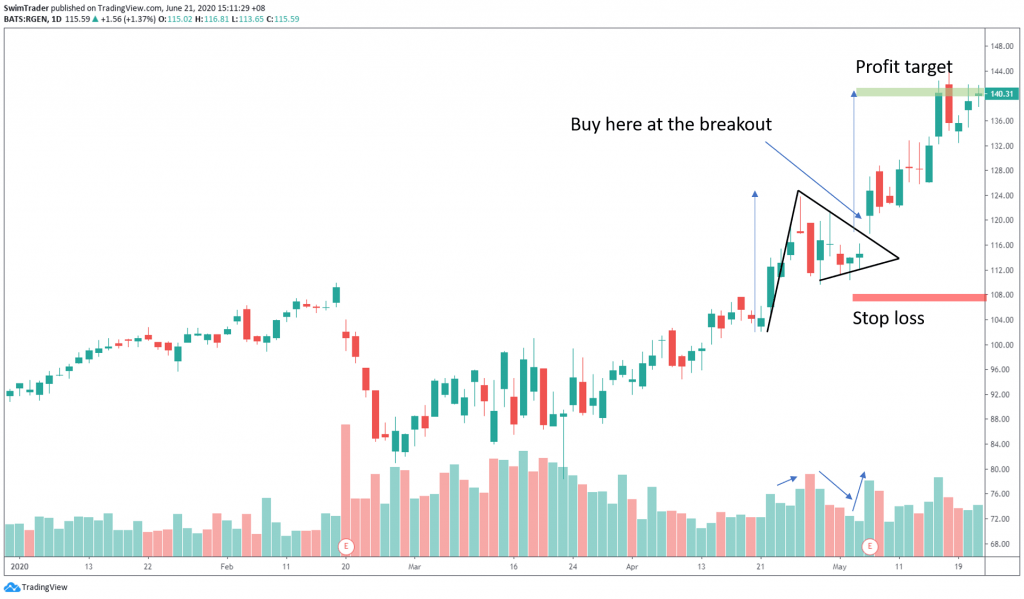
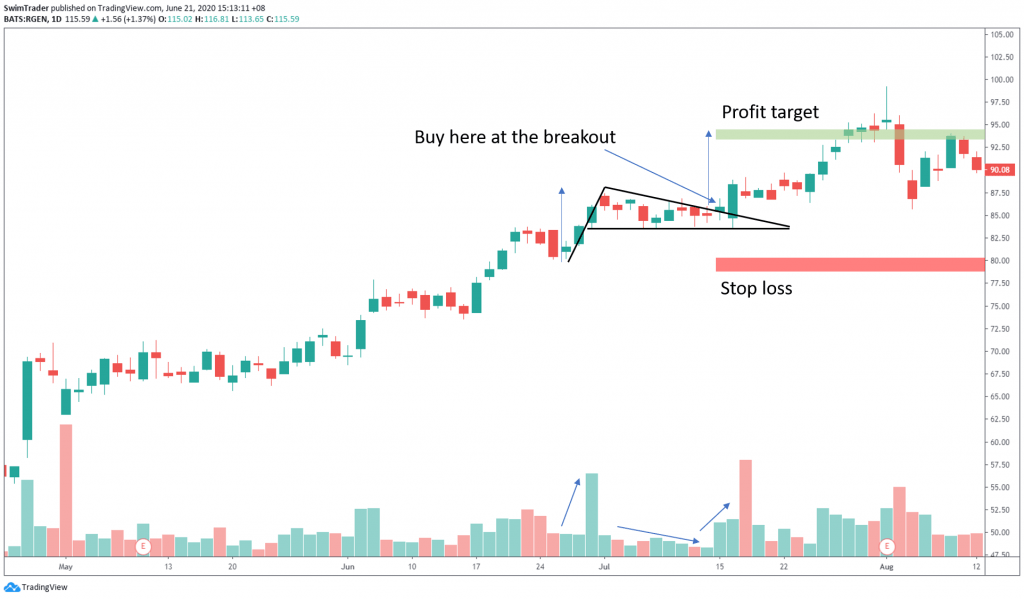
- Watch for price to break the flag/pennant/wedge
- Work out your position sizing and stop loss level
- Enter your position at the breakout
Conclusion
Did you notice that these 3 chart patterns are common when prices are trending? Entering your positions based on these chart patterns allows you to buy/short sell at a good price. Best of all, you don’t have to wait for long before you begin sitting on profits!
Here’s What You Can Do To Improve Your Trading Right Now:
#1 Register for our market outlook webinars by clicking here
#2 Join us in our Facebook Group as we can discuss the various ways of applying this by clicking here
#3 Never miss another market update; get it delivered to you via Telegram by clicking here
#4 Grab a front row seat and discover how you can expand your trading arsenal in our FREE courses (for a limited time only) by clicking here
Trade safe!
