By now you would’ve realized that indicators work best when prices are trending.
The Donchian Channels indicator was created by the father of trend following – Richard Donchian. Many successful traders use this indicator, notably Richard Dennis and his 23 disciples.
This is a story for another time. Let’s dive in to learn all about this indicator with Ball Corp (BLL) as a case study.
Donchian Channel Explained
What Is It?
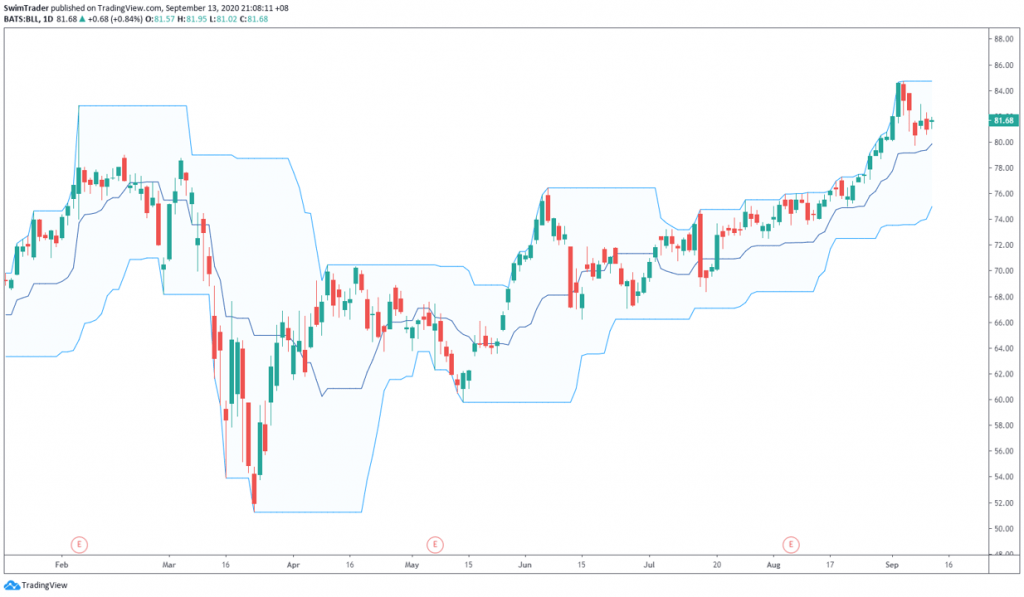
Donchian Channels is a trend following indicator which helps traders ride trends out. It looks similar to Bollinger Bands and Keltner Channels, but there are several differences which you’ll soon learn of.
Similar with the Bollinger Bands and Keltner Channels indicators, a higher volatility period will result in a wider channel.
The default length for the Donchian Channels is 20-period, where the upper channel is at the highest price of the past 20-period and the lower channel is at the lowest price of the past 20-period.
The middle line is the average of both channels, as explained in the section “Geek Speak”.
What Is It Used For?
#1 Provide you with a direction bias of the market
#2 Signals a breakout
#3 Indicate entry points
#4 Indicate exit points
Geek Speak (skip this section if Math gets you dizzy)
How To Calculate Donchian Channels?
Similar to Bollinger Bands and Keltner Channels, the Donchian Channels indicator consists of 3 lines.
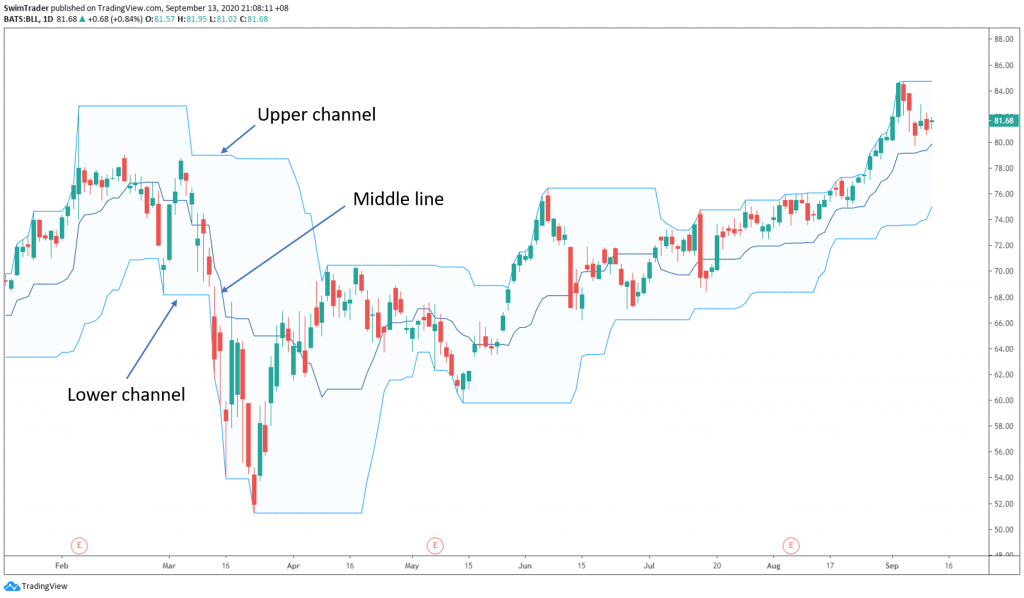
They are the:
#1 Upper channel = High of the last N days
#2 Lower channel = Low of the last N days
#3 Middle line = Average of the upper and lower channels
Where “N” is the length duration for the upper and lower channels.
4 Donchian Channels Secrets To Let Your Winners Run
#1 Follow The Direction Of The Market
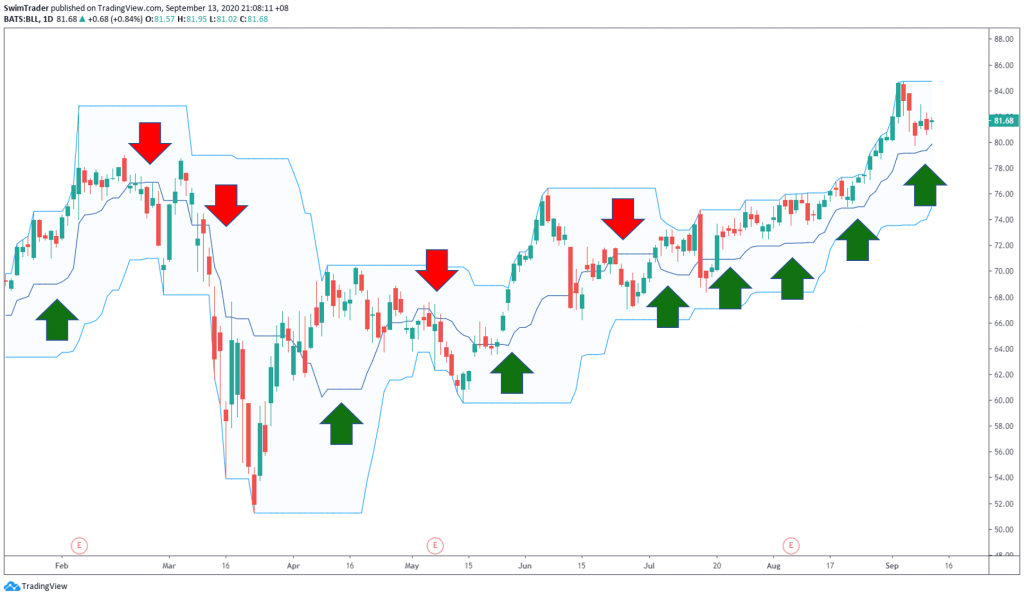
When prices are above the middle line, the stock is bullish (see the green arrows). You’ll want to go Long.
When prices are below the middle line, the stock is bearish (see the red arrows). You’ll want to go Short.
#2 Pay Attention To Its Breakout Signals
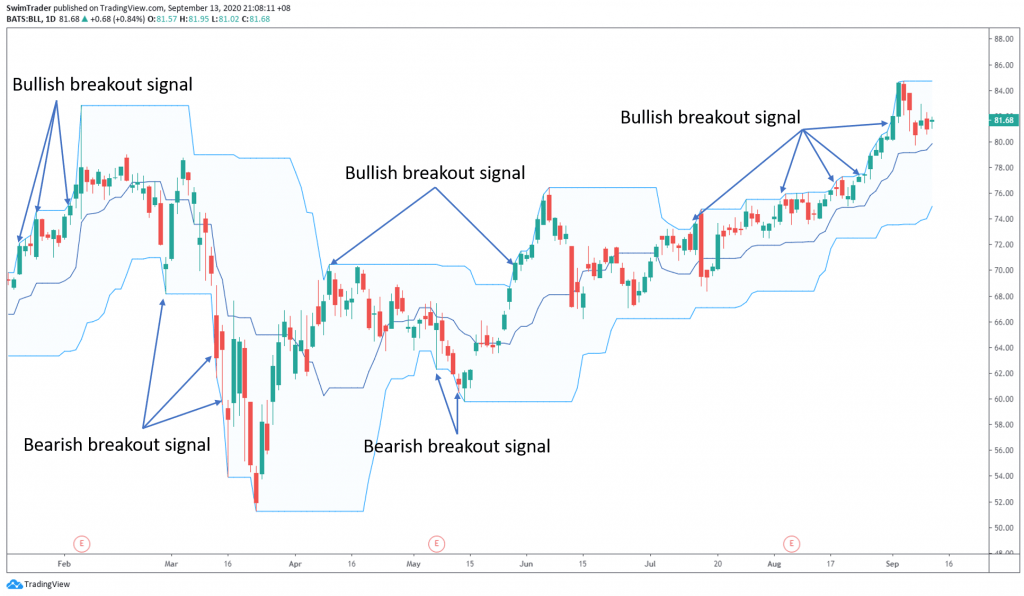
When price breaks out of the upper channel, it signals that the stock is getting strong and you should watch it closely for a good buying point.
When price breaks out of the lower channel, the stock is getting weaker and you should pay attention to it for a good entry point to sell it short.
What makes a good buying and short-selling point? This brings me to the next secret.
#3 Include Chart Patterns
You may have read that you should buy (or short-sell) on the breakout of the upper (or lower) channel respectively. You’ll face a lot of frustration when the stock stops trending or retraces sharply.
To reduce your level of frustration, you’ll want to include your knowledge on chart patterns. This will increase the reliability of your entry points, greatly reducing the amount of stress and fear you’ll face.
Read how you can overcome fear and greed here and here.
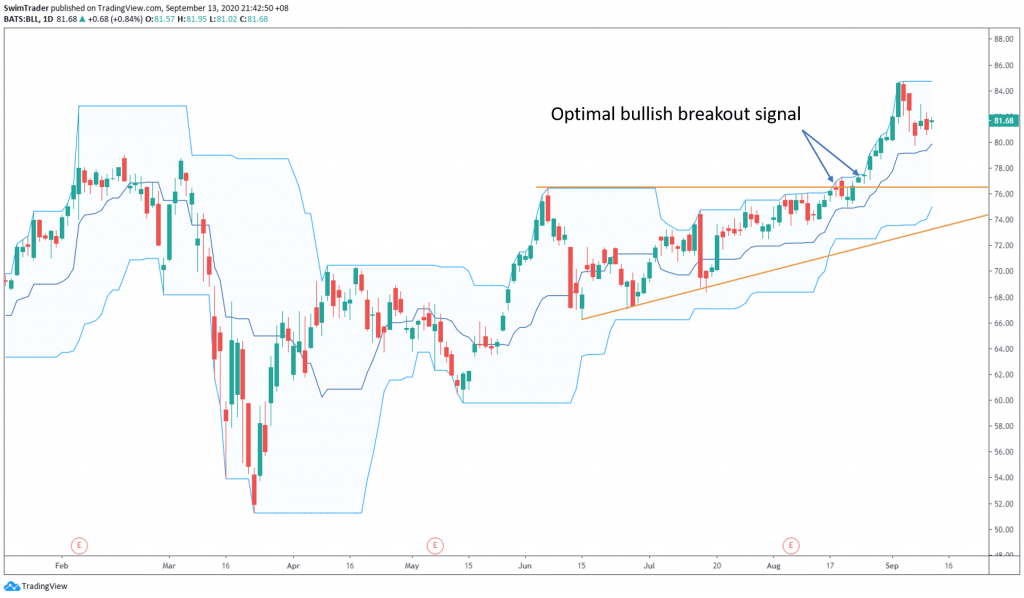
Do you see a triangle chart pattern marked out in orange?
#4 Know When To Exit
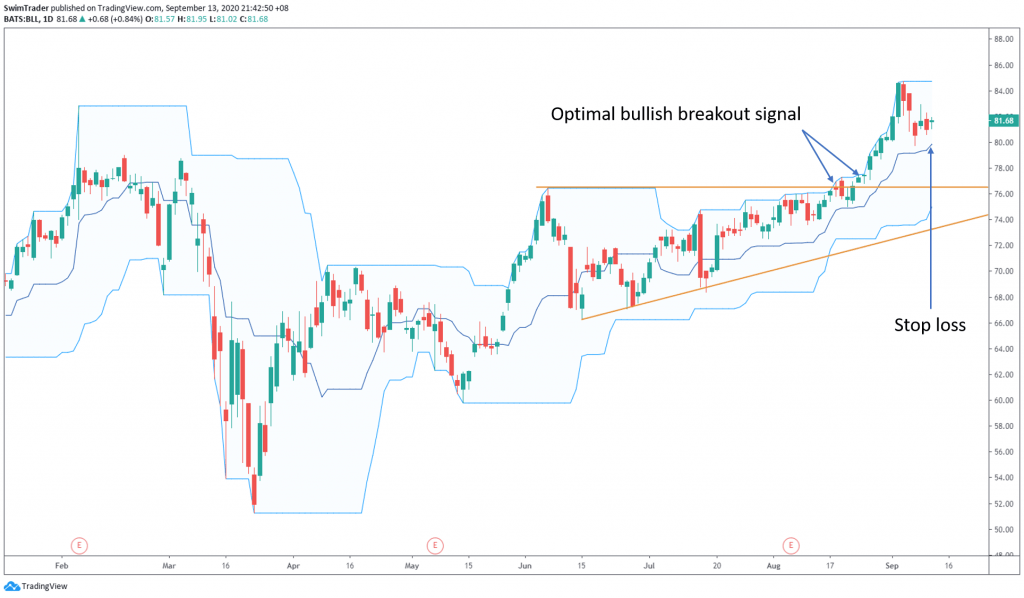
Knowing when to exit a trade is as important as knowing when to enter. Now that you know when you should enter, let’s look at when you should exit.
The middle line is a good point to exit a trade (both Long and Short). This allows you to ride the trend for as long as it continues and hop off at the first sign of danger.
4 Things You Must Remember About Donchian Channels
#1 It tells you the trend of a stock. Trade in the direction of the trend to increase your chances of making money
#2 It signals a breakout
#3 Include chart patterns for more reliable entry points
#4 Exit fast by using the middle line as a signal
Here’s What You Can Do To Improve Your Trading Right Now:
#1 Register for our market outlook webinars by clicking here
#2 Join us in our Facebook Group as we can discuss the various ways of applying this by clicking here
#3 Never miss another market update; get it delivered to you via Telegram by clicking here
#4 Grab a front row seat and discover how you can expand your trading arsenal in our FREE courses (for a limited time only) by clicking here
Trade safe!

