
Memorizing candlestick patterns is not the way to go. Understanding the trading psychology behind the candlestick patterns is.

The famous Mahatma Ghandi once said
Your beliefs become your thoughts.
Your thoughts become your words.
Your words become your actions.
Your actions become your habits.
Your habits become your values.
Your values become your destiny.
In Part 1 and Part 2, you’ve discovered the more common bullish reversal candlestick patterns. I’ve shared 7 rare and powerful bullish reversal candlestick patterns in Part 3.
In this article, you will learn 5 more lesser known bullish reversal patterns that are also rare and powerful. Let’s dive in to gain an additional edge over the stock markets!
#1 Homing Pigeon
How does the Homing Pigeon bullish reversal candlestick pattern look like? What are its characteristics?

The 2 vertical lines before the Homing Pigeon pattern represent the range of the previous candles. The previous candles’ color, shape and size are not important. The most important thing is that they are trending down.
Note that the 2nd candlestick must gap up, but not higher than the body of the 1st candlestick (ie open below the opening price of the 1st candlestick).
Trading Psychology
The Homing Pigeon candlestick pattern showed up on the chart of DHI in July 2020. What was the psychology behind this bullish reversal candlestick pattern?
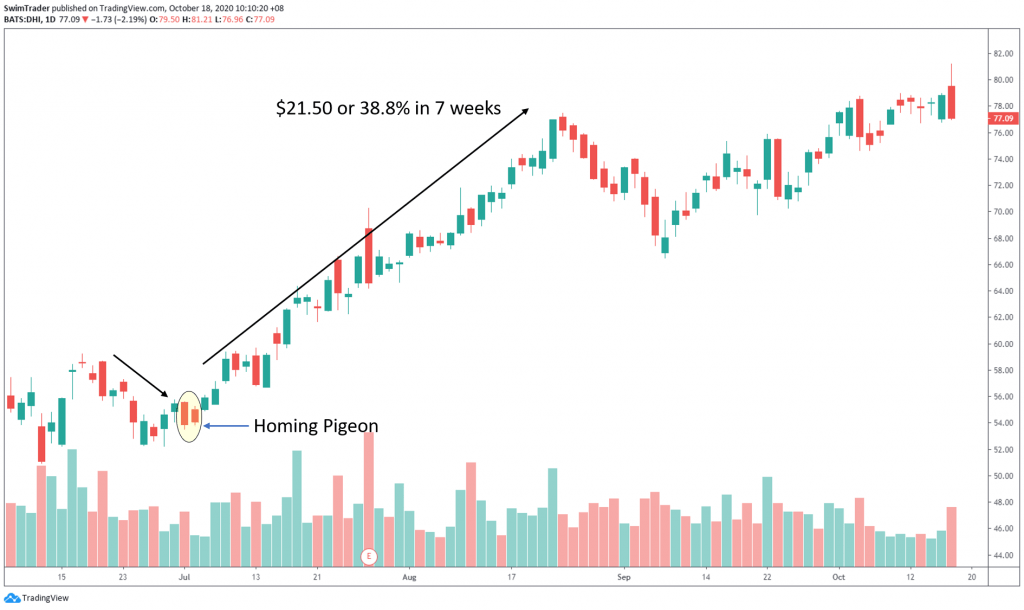
Remember that the both candlesticks are bearish? The 2nd candlestick opens on a gap up and its body lies within the body of the 1st.
The gap up indicates that the bulls are forcing their way back in.
Throughout the day, the bears are still pretty much in charge as they manage to push prices down. Notice that the closing price of the 2nd candlestick is still read?
But don’t be fooled. The bulls are not giving up without a tough fight. They eventually win and prices shot up $21.50 (38.8%) in 7 weeks!
#2 Matching Low
The Matching Low bullish reversal candlestick pattern has the following characteristics and significance.
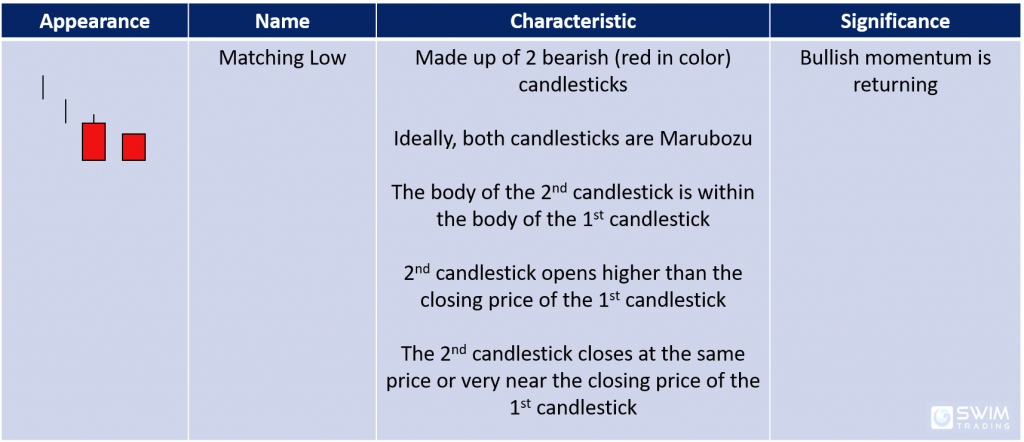
The 2 vertical lines before the Matching Low pattern represent the range of the previous candles. The previous candles’ color, shape and size are not important. The most important thing is that they are trending down.
Note that the 2nd candlestick must gap up, but not higher than the body of the 1st candlestick (ie open below the opening price of the 1st candlestick).
The closing price of both candlesticks is the same.
Trading Psychology
The Matching Low chart pattern appeared on the chart of M in late May 2020. Let’s observe the psychology behind this candlestick pattern.

Similar to the Homing Pigeon candlestick pattern, both candlesticks are bearish.
The 2nd candlestick opens on a gap up, indicating that the bears are losing momentum. However, the bears are still in charge for that day as they manage to press prices down till end of the day.
The next day, the bulls come back stronger. Do you see a bullish engulfing candlestick pattern? That’s a confirmation that the bulls are now fully in charge.
The price of M rose by $2.25 (43%) in just a week.
#3 Three White Soldiers
Here’s a list of the characteristics and significance of the Three White Soldiers bullish reversal candlestick pattern.
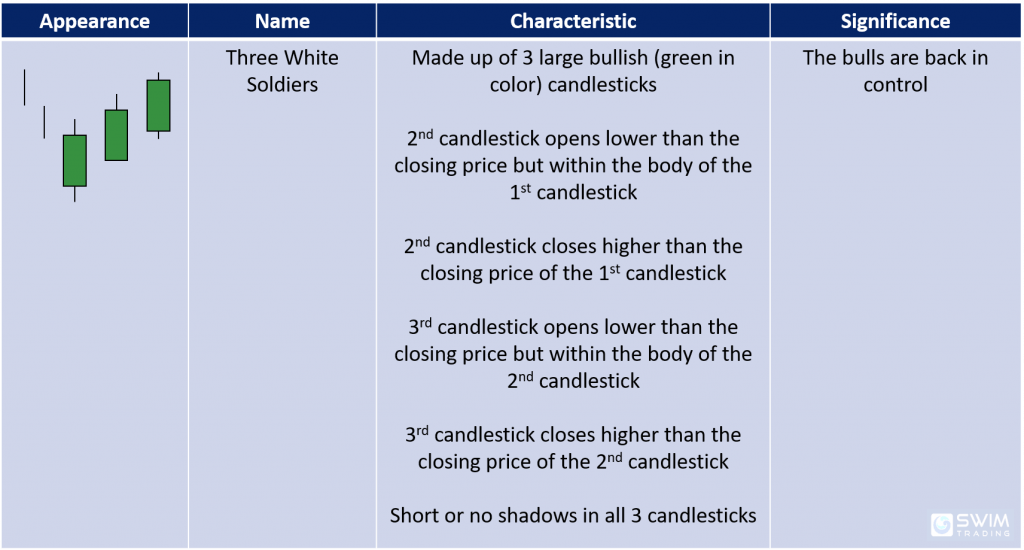
The 2 vertical lines before the Three White Soldier pattern represent the range of the previous candles. The previous candles’ color, shape and size are not important. The most important thing is that they are trending down.
It is important to note that the opening prices of the 2nd and 3rd candlesticks must gap up within the body of its previous candlestick.
Trading Psychology
When this chart pattern appears after a downtrend, you’ll want to buy the stock immediately. Let’s use the chart of RCL as a case study.
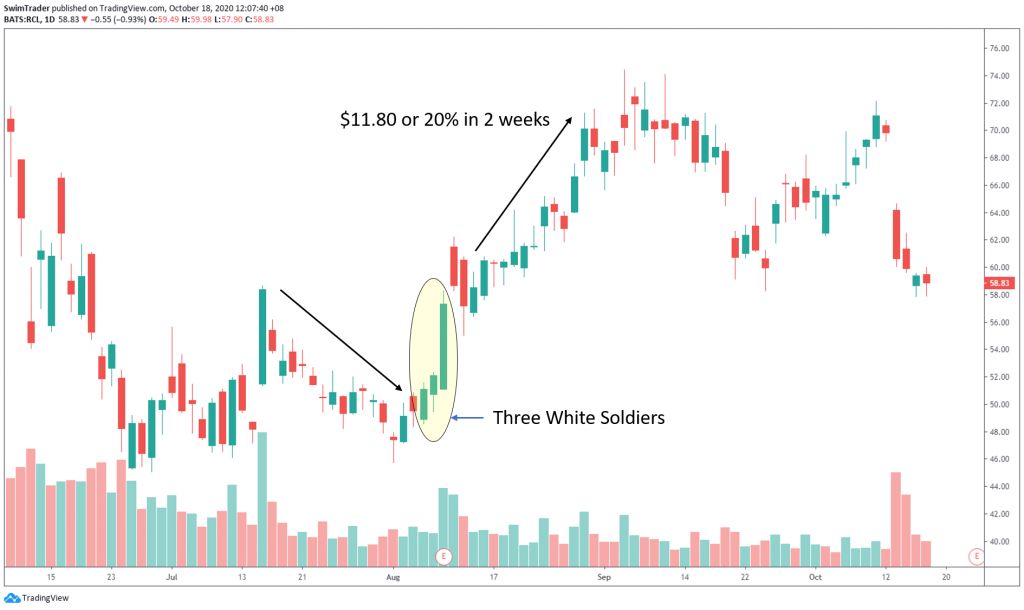
All 3 candlesticks are bullish and with short wicks (or even without any wicks). This tells you that the bulls are firmly in control. The bears will still try to push prices down (as show by a gap down on the opening prices of the 2nd and 3rd candlesticks). However, the bulls are much stronger and a bullish run is on the horizon.
A quick rally ensued, lifting prices by $11.80 (20%) in just 2 weeks.
You’ll also want to see high volume which is a further confirmation.
#4 Concealing Baby Swallow
Here’s a table of the key characteristics of the Concealing Baby Swallow candlestick pattern.

As always, the 2 vertical lines before the Concealing Baby Swallow pattern represent the range of the previous candles. The previous candles’ color, shape and size are not important. The most important thing is that they are trending down.
The opening price of the 4th candlestick must gap up and close slightly lower than the closing price of the 3rd candlestick. This is what makes this bullish reversal candlestick pattern so rare.
Trading Psychology
What can you make sense of the Concealing Baby Swallow candlestick pattern in the chart of JD in early Aug 2020?
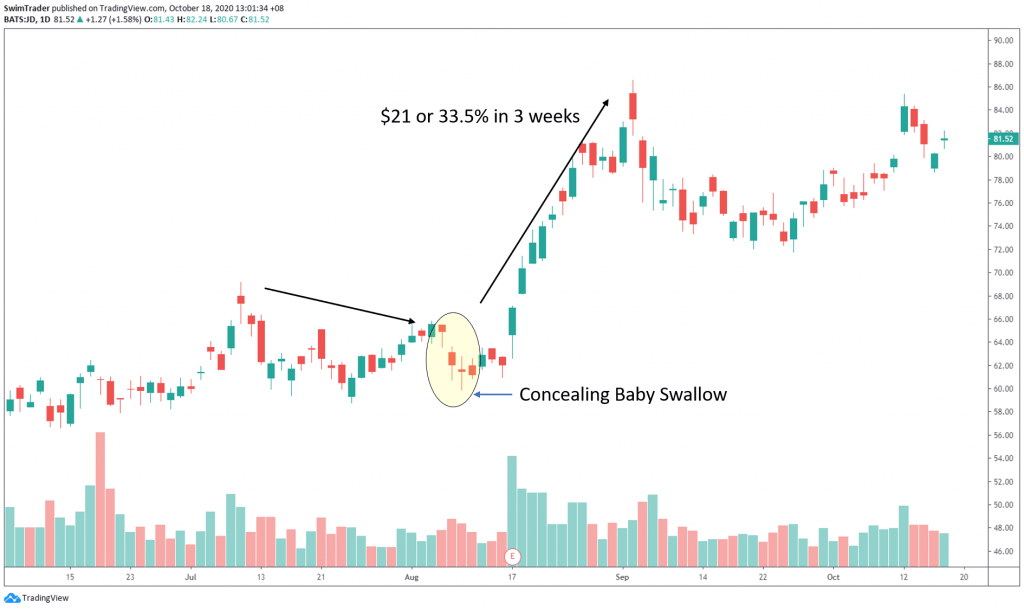
Prices have been trending lower for a month before the Concealing Baby Swallow candlestick pattern appeared. This shows that the bears are strong and in charge.
While the Concealing Baby Swallow candlestick pattern was forming, prices gapped down for the 1st 3 candlesticks. The bears are still very strong, but there are signs that they are getting weaker. This is shown by the Doji (3rd candlestick). The bulls launched a ferocious attack to push prices up before being defeated (only marginally) by the bears.
While the 4th candlestick gapped up at the open, the bears are not giving up easily. The bears fought back to recover some lost ground as they managed to press prices down. This resulted in a red candlestick for that day.
But the closing price of the 4th candlestick is just a little lower than the closing price of the 3rd candlestick. This is a huge sign that the bears have lost steam.
On the next day, the bulls charged in once again and won, bringing prices up by $21 (33.5%) in 2 weeks.
You’ll want to see higher volume and volatility as this candlestick pattern is being formed.
#5 Ladder Bottom
What are the key characteristics and significance of the Ladder Bottom bullish reversal candlestick pattern?
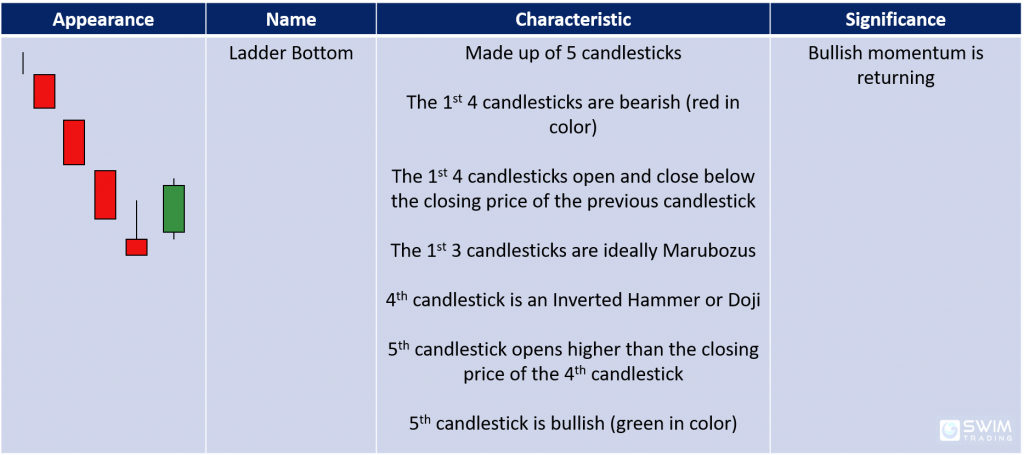
As with the rest of the candlestick reversal patterns, the vertical line before the Ladder Bottom pattern represents the range of the previous candle. The previous candle’s color, shape and size are not important. The most important thing is that the stock is in a downtrend.
This looks almost identical to the Concealing Baby Swallow candlestick pattern, except that there are 5 candlesticks and that the last candlestick is bullish.
Trading Psychology
This candlestick stick pattern can be found in the chart of AEP in early Feb 2018.

The bears were in total control. Prices were on the slide down until the Ladder Bottom candlestick pattern appeared.
The 2nd and 4th candlesticks gapped down on the open. This shows that the bears were still very strong.
However, there are signs that the bulls are challenging the bears. This is clearly shown by the long upper wick of the 4th candlestick, which is an Inverted Hammer.
The bulls returned and forced prices up before they lost to the bears. The bears only won marginally as the closing price was just a little below its opening price.
The bears have disappeared on the 5th candlestick. This can be inferred from the gap up and the appearance of a Marubozu. Prices quickly rose by $2.65 in 4 short days.
Be sure to look out for high volume on the Marubozu for a higher success rate!
5 Candlesticks Patterns You Have Mastered Today
That marks the end of the series on bullish reversal candlestick patterns! Here’s a recap of the rare and powerful candlestick patterns that you’ve learnt today:
#1 Homing Pigeon
#2 Matching Low
#3 Three White Soldiers
#4 Concealing Baby Swallow
#5 Ladder Bottom
You’ll be learning about bullish continuation patterns in my next article.
Here’s What You Can Do To Improve Your Trading Right Now:
#1 Register for our market outlook webinars by clicking here
#2 Join us in our Facebook Group as we can discuss the various ways of applying this by clicking here
#3 Never miss another market update; get it delivered to you via Telegram by clicking here
#4 Grab a front row seat and discover how you can expand your trading arsenal in our FREE courses (for a limited time only) by clicking here
Trade safe!
