The US stock market reached a new high in mid-Feb 2021 and has been dropping since. Is this drop a concern?
It seems that this drop is a normal market correction. It is healthy for the market to pullback and open opportunities for new trades.
Shown below is the chart of the S&P 500 E-min futures. Can you name the circled candlestick pattern?
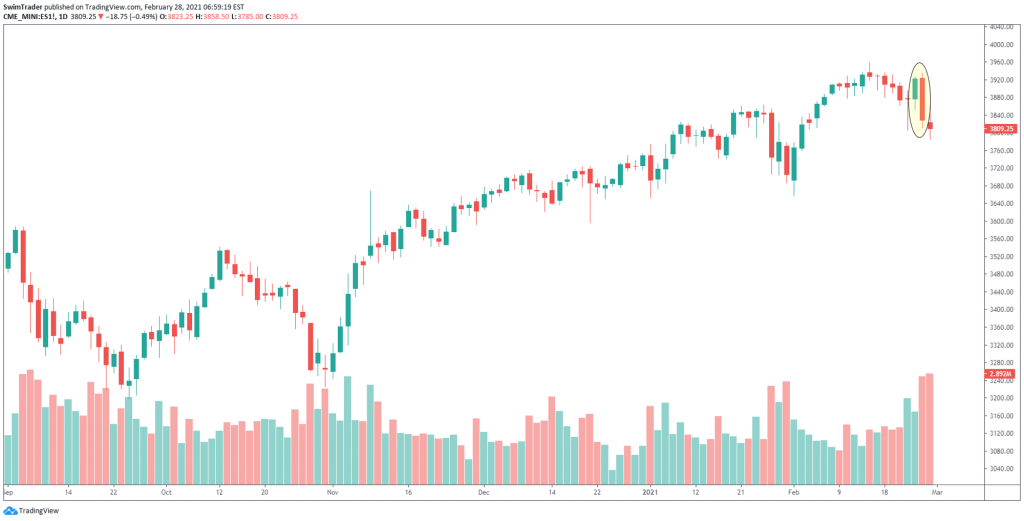
Do you need a hint? This candlestick pattern is shown in Part 1.
Yes! It is the Bearish Engulfing candlestick pattern.
I’ve covered 10 bearish reversal candlestick patterns in my previous articles which you can read by clicking: Part 1, Part 2, Part 3, Part 4.
Here, you’ll learn of 4 more bearish reversal candlestick patterns. Let’s jump right in!
#1 Upside Gap Two Crows

Don’t be bothered by the 2 vertical lines preceding the Upside Gap Two Crows candlestick pattern. They just symbolize that this candlestick pattern is found in an uptrend.
The 2nd candlestick must gap up and close lower. The gap must not be covered.
The 3rd candlestick must gap up and close lower too. However, it must cover the gap, and closes at or slightly below the gap between the 1st 2 candlesticks.
Trading Psychology
The Upside Gap Two Crows appeared on the chart of AXP in mid-Aug 2020. Let’s seek to understand the psychology of the market participants then.
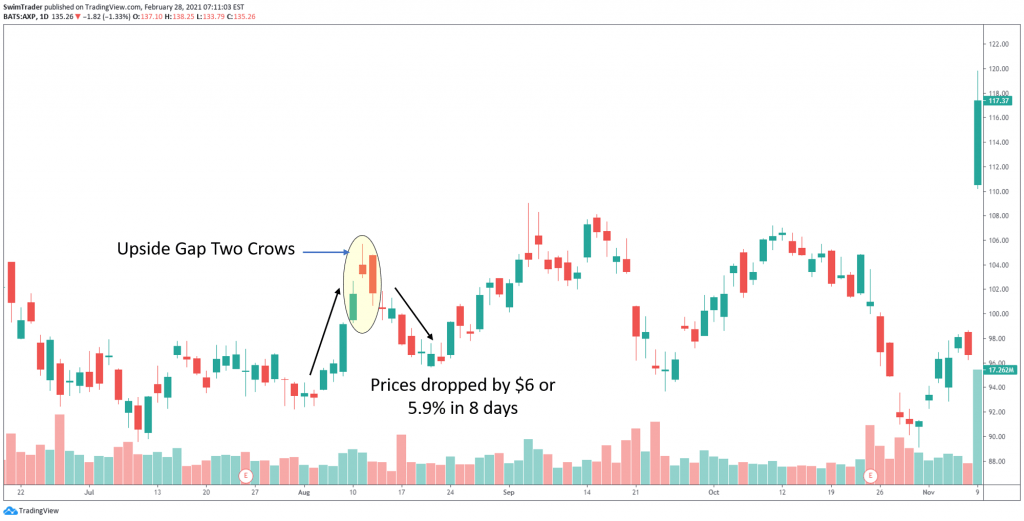
AXP shot up in early Aug 2020 just before the Upside Gap Two Crows candlestick pattern formed. This meant that the market participants were extremely bullish on this stock.
Optimism continued as the 2nd candlestick gapped up. The bulls continued to push prices up to $105.70 before the bears stepped in to send prices lower late in the trading session.
The market participants were still optimistic as the 3rd candlestick gapped up too. However, all optimism faded almost immediately. The bears challenged the bulls and the bulls retreated without a fight.
The absence of the bulls allowed the bears to push prices way below its opening price, engulfing the 2nd candlestick!
This was an ominous sign. Prices slid by $6 or 5.9% in slightly more than a week.
#2 Two Crows
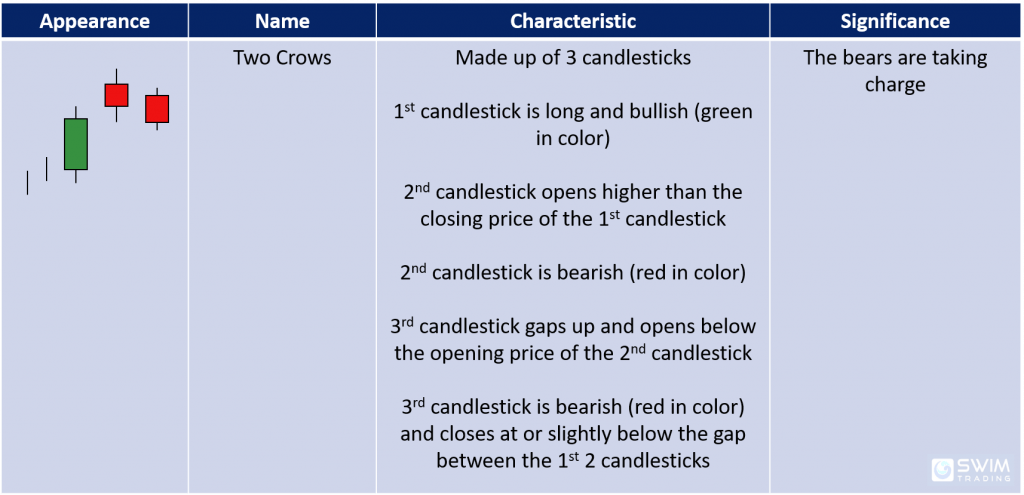
The 2 vertical lines represent an ongoing uptrend.
This candlestick pattern is similar to the Upside Gap Two Crows candlestick pattern.
The only difference lies in the 3rd candlestick. The 3rd candlestick opens the day with a gap up, but its opening price is lower than the opening price of the 2nd candlestick.
Trading Psychology
The Two Crows bearish reversal candlestick pattern can be seen on the chart of DOCU in early Dec 2020.

Prices were trending higher. Market participants were clearly bullish on DOCU.
The 2nd candlestick gapped up massively (by 5%). The bulls were in total control. They managed to send prices higher by another $10.50 before the bears got awoken.
The bears mounted a challenge and won that day. A long upper wick was created and prices closed lower.
This bearish momentum carried on the next day as the 3rd candlestick gapped down. Prices continued to slide throughout the day.
Market participants are dumping the shares of DOCU furiously. Prices slid by $17.10 (7.35%) in just 3 days!
#3 Deliberation
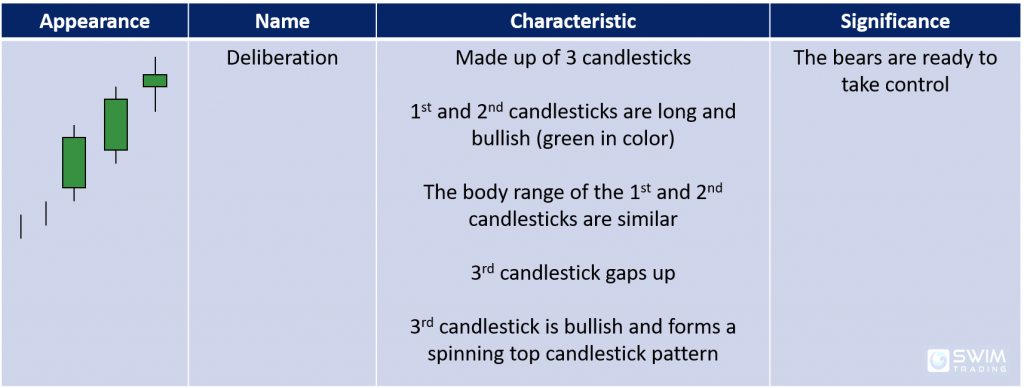
As usual, the 2 vertical lines represent an ongoing uptrend.
Note that the body length of the 1st and 2nd candlesticks are the same. They need to be long too.
The 3rd candlestick gaps up and has a tiny body with upper and lower wicks.
Trading Psychology
The Deliberation bearish reversal candlestick pattern is circled in the chart of HOLX.
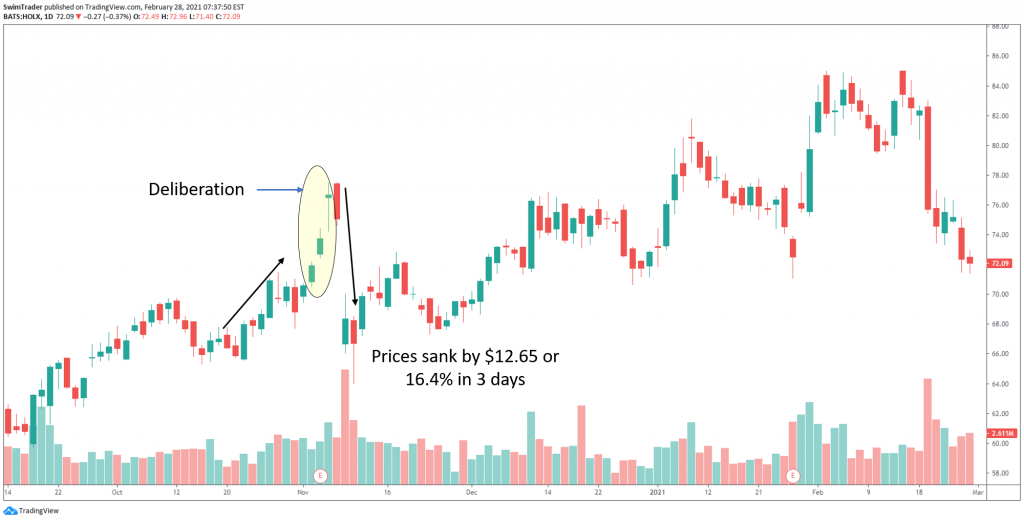
Let’s have a peek into the minds of the market participants.
The market participants were ultra bullish on HOLX. Prices flew and there were several gap ups in the process. The bulls were unstoppable.
All good things must come to an end. Signs of weakness started to show in the 3rd candlestick.
Prices gapped up but came tumbling down as market participants felt that prices were getting too high. They started selling off their holdings to enjoy the profits. This resulted in a long lower wick.
There were some who felt that HOLX was still worth the buy, hence they entered to buy shares of HOLX, causing it to close just above its opening price.
The next day, the bullish momentum continued for a short while as prices gapped up. It soon became a day of bloodshed as the bears took full control, resulting in a collapse of $12.65 (16.4%) in the next few days.
#4 Advance Block
The Advance Block bearish reversal candlestick pattern looks similar to the Deliberation candlestick pattern. Test yourself to see if you can spot the 2 small differences.

Did you manage to spot the 2 differences?
There are no gaps between each candlestick. The body size of each candlestick decreases too.
Trading Psychology
NET has been on a gravity defying run from mid-Sep to mid-Oct 2020. Then, the Advance Block bearish reversal candlestick pattern showed.
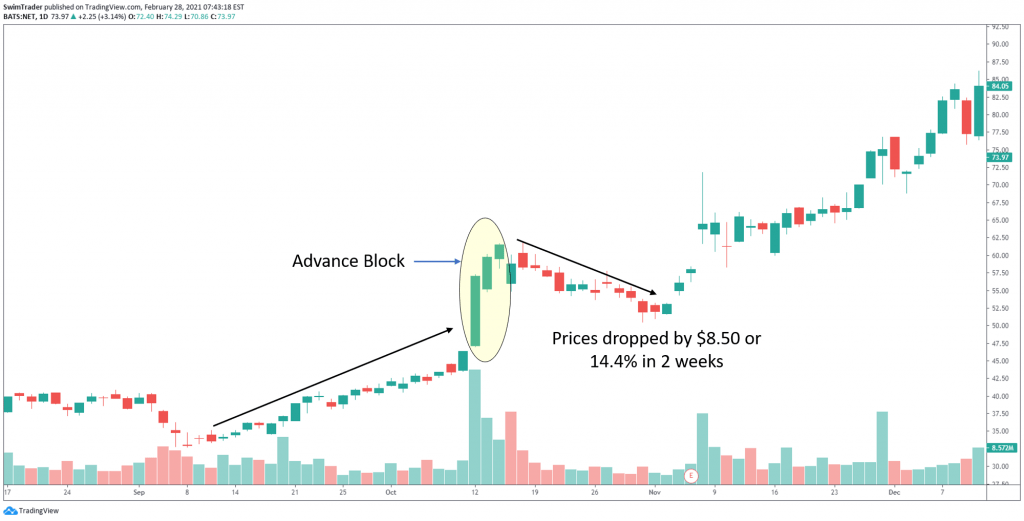
Market participants turned exuberant at the start of the formation of the Advance Block candlestick pattern. This can be inferred from the gradient of its rise in price and the body size of the candlesticks.
Bullish momentum started to wane as prices started to open lower than the closing price of its previous candlestick. Volume started to decrease, adding conviction that a bearish reversal was coming soon.
There’s no doubt that the bulls were still in charge. However, profit taking was happening as the Advance Block candlestick pattern was formed.
Immediately after the Advance Block candlestick pattern was formed, prices collapsed by 14.4% ($8.50) in a matter of 2 weeks.
3 Things You Must Remember About These Candlestick Patterns

#1 You can infer the bullish/bearish strength of a candlestick based on the size of its body
#2 Market corrections and bearish reversals play an important role in the stock market
#3 Market corrections and bearish reversals can be swift and deep
Here’s What You Can Do To Improve Your Trading Right Now:
#1 Register for our market outlook webinars by clicking here
#2 Join us in our Facebook Group as we can discuss the various ways of applying this by clicking here
#3 Never miss another market update; get it delivered to you via Telegram by clicking here
#4 Grab a front row seat and discover how you can expand your trading arsenal in our FREE courses (for a limited time only) by clicking here
Trade safe!

