
“You mean there are free and powerful tools that I can use for swing trading?” Absolutely!
Trendlines is one such tool that I use to help me analyze candidates for swing trading. Here’s an example of trendlines on the chart of SBUX.
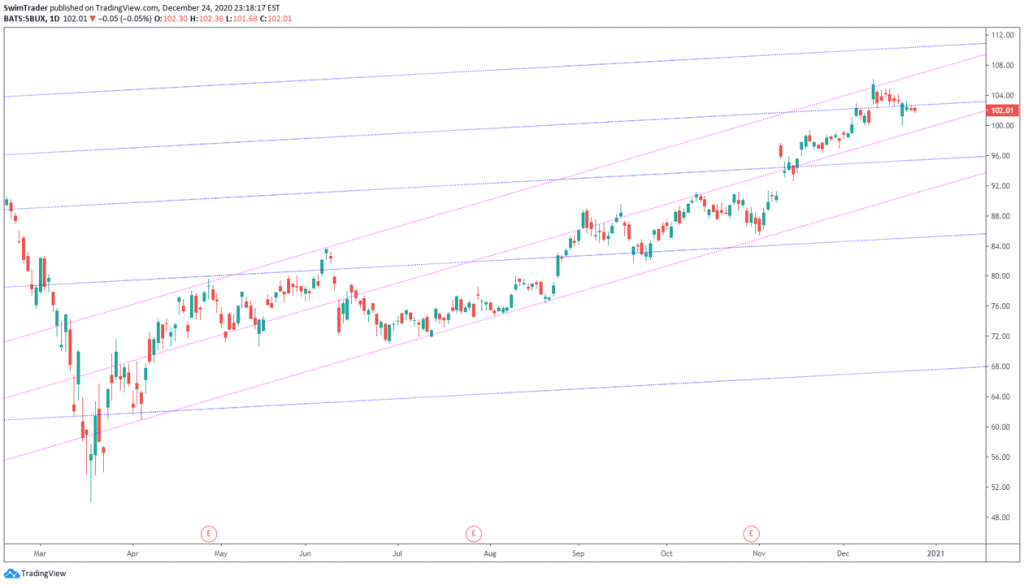
The long-term trendlines (10 years) are in blue while the short-term trendlines (8 months) are in pink. What do you notice?
Don’t worry if you are lost. Using the chart of SBUX as a case study, I will explain why you should use trendlines and how to use them.
Why Draw Trendlines?
#1 Turning Points
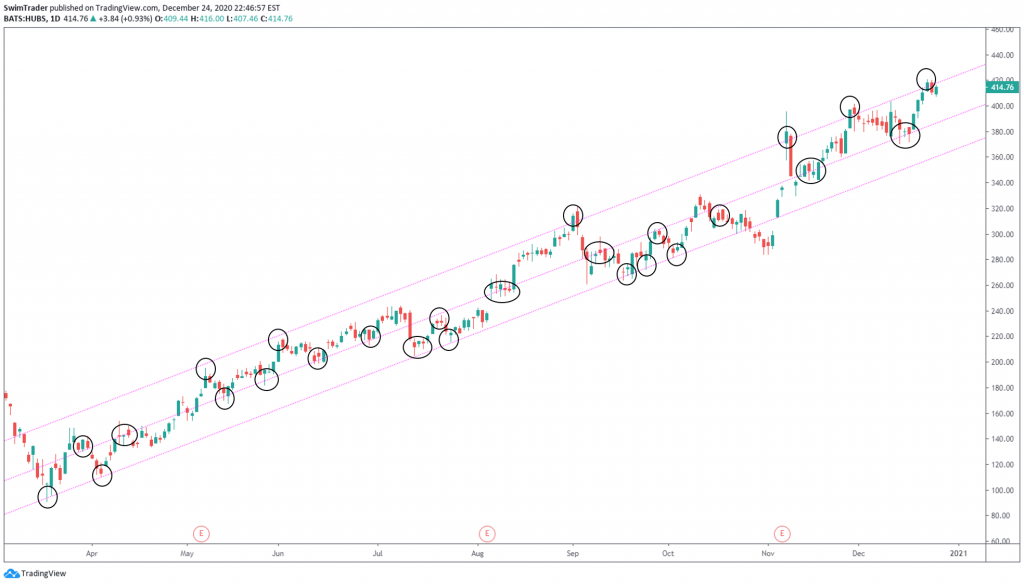
When trendlines are drawn well, you’ll start to notice turning points (circled out in the chart of HUBS below). As you project the trendlines forward, you’ll benefit from identifying possible turning points ahead.
Since trendlines are possible turning points, you may not want to buy a stock when there is an upper trendlines nearby, saving you from potential losses. Case in point, HUBS.
#2 Support And Resistance
Turning points… This sounds like support and resistance.
Guess what? You are right!
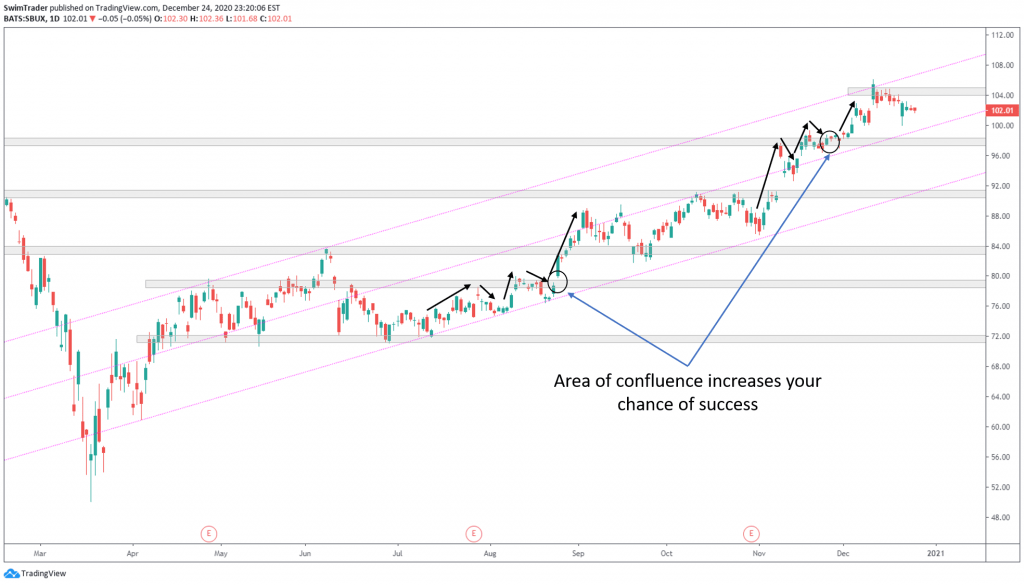
Support and resistance don’t necessarily need to be horizontal. Trendlines are excellent diagonal support and resistance lines. When combined with the horizontal support and resistance zones, you’ll increase the chance of success at trading.
Let’s have a look at the chart of SBUX with its short-term trendlines and horizontal support and resistance zones plotted.
#3 Speed
Which stock is rallying faster?
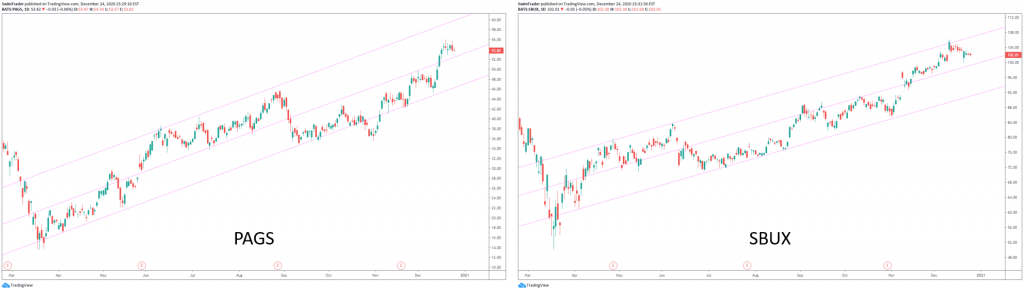
PAGS is climbing at an angle of 20 degrees which SBUX is climbing at an angle of 16 degrees. The gradient of trendlines tell you of the speed a stock is climbing at.
This is how you can filter the stocks you have on your watchlist for the strongest ones to pay more attention to. Because all of us have limited trading capital, we need to make our money work hard by buying strong and fast stocks that are in a Type 1 market.

Read about the ideal strategies to trade in the 4 different market types.
How To Draw Trendlines?
Drawing trendline makes sense to you. What makes a good trendline? How do you draw trendlines?
I’ll be using the charting platform, TradingView, to draw trendlines. You can sign up for free and get started immediately.
Here are the steps to drawing good trendlines.
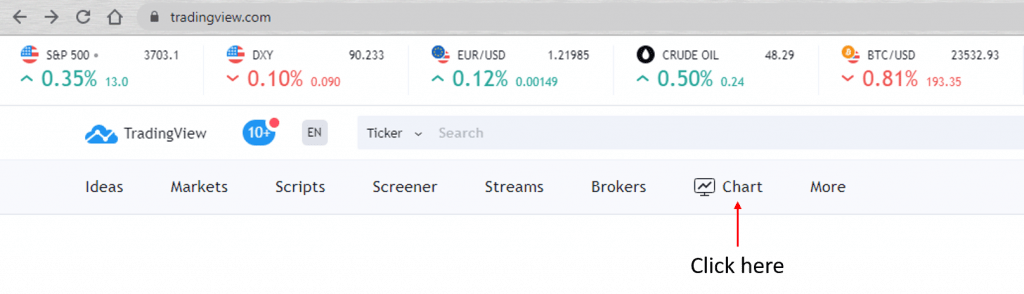
#1 Click “Chart”
At the top of TradingView’s website, you’ll see a “Chart”. Click on it.
#2 Select Candlesticks
You’ll see a bar at the top of your chart. Change the format of your chart to candlesticks by clicking on the icon next to the timeframes.

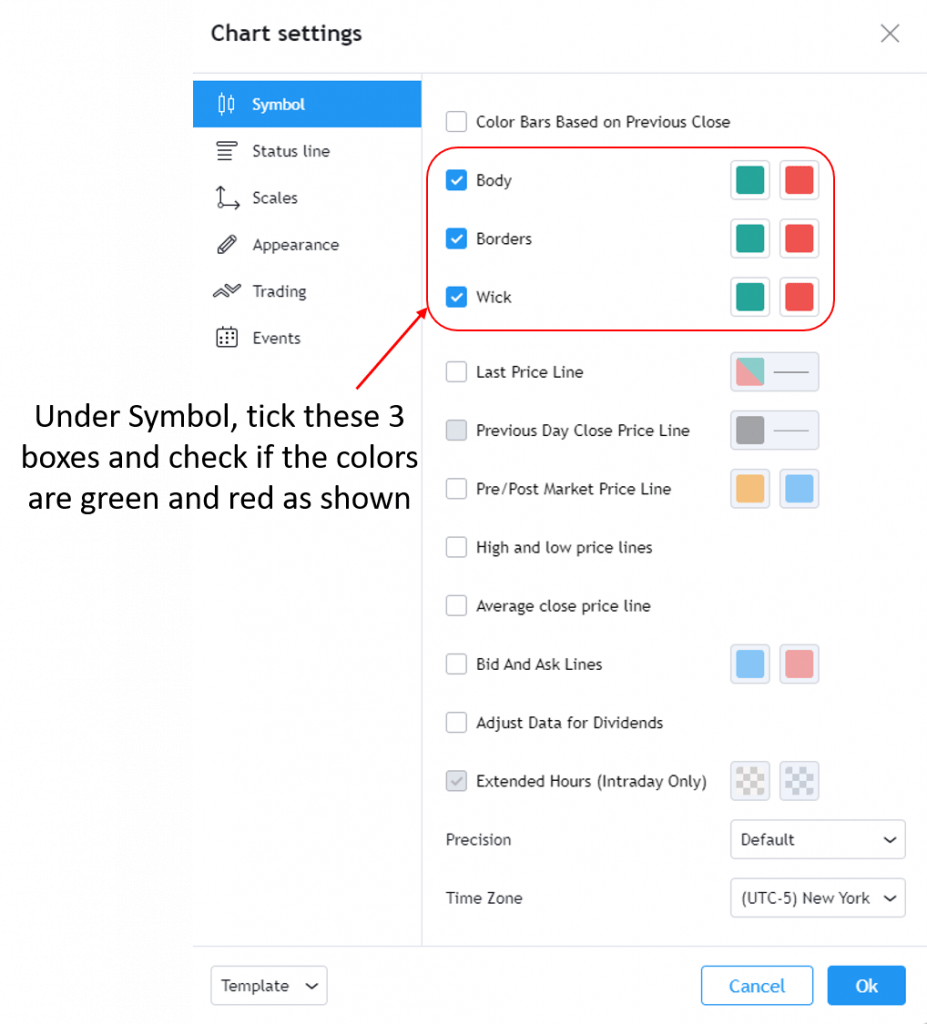
#3 Settings
Right click on the chart and select “Settings”.
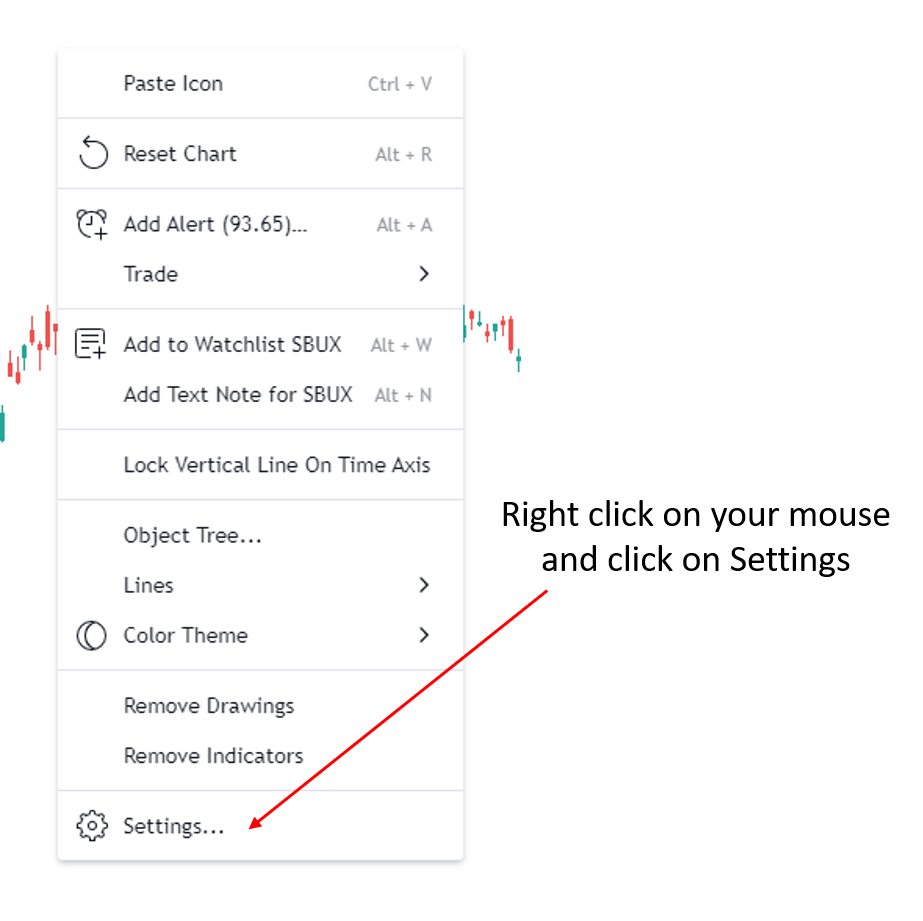
Click on “Symbol” and tick the following boxes – “Body”, “Borders”, “Wicks”. The colors to the right of “Body”, “Borders”, and “Wicks” should be green and red. Next, click on “Ok”.
#4 Enter Stock’s Ticker Symbol
There are 2 ways to enter a stock’s ticker symbol. You can either type the stock’s ticker symbol anywhere in the chart OR enter it in the search bar on the top left hand corner.

Let’s enter “SBUX”. SBUX is the ticker symbol of Starbucks.
Help! There’s a long list of “SBUX” from the symbol search results. Select the one that’s listed in the USA (that’s boxed in the photo above).
#5 Zoom Out
Zoom out to the last crash or last major low. This means that you should be looking at the chart of SBUX from Mar 2020 to plot your short-term trendlines.
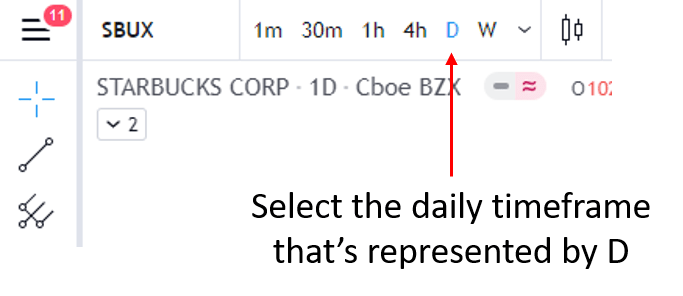
#6 Select Timeframe
Select the daily chart timeframe for short-term trendlines, and weekly chart timeframe for long-term trendlines (zoom out to at least 5 years).
You can do so by clicking on the bar at the top.
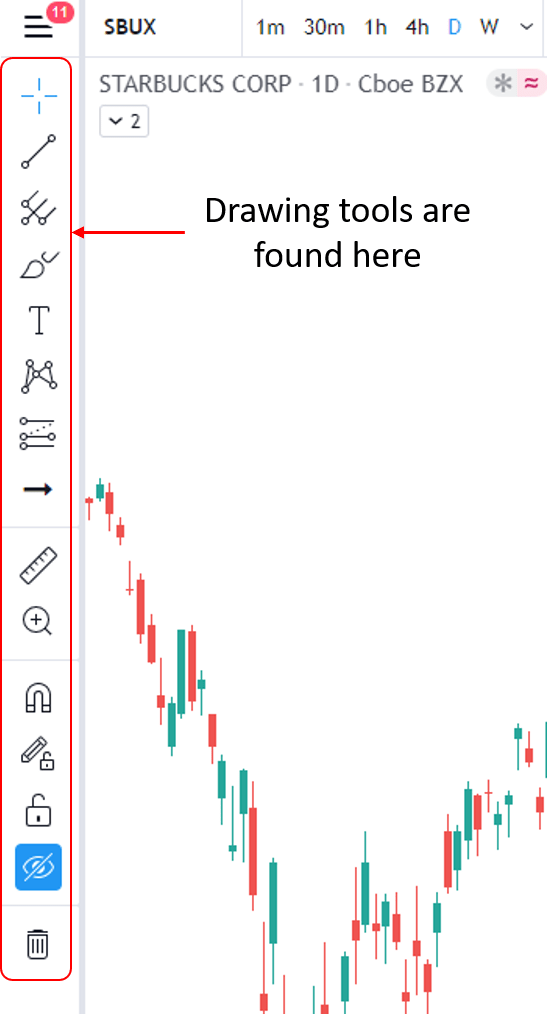
#7 Draw Trendlines
The tools are on the left side of the chart.
We will only plot short-term trendlines as swing trading is very much short-term in nature, spanning from days to a week or so.
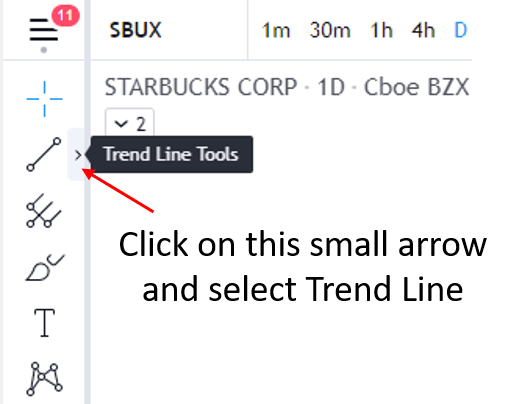
Click on the small arrow next to the diagonal trendline icon and select “Trend Line” or simply hold “Alt + T” and click on 2 price points.
Drawing trendlines is an art and science. This means that it takes practice to draw good trendlines. What should you look out for in drawing trendlines?
Since trendlines are diagonal support and resistance lines, you’d plot them the same way where the trendlines would touch multiple candlesticks (aka best fit line).
Adjust the angle and find the best fit line. I’d usually start from the bottom of the chart.
Now that you have a trendline drawn which touches prices a number of times, clone it. You can do so by right clicking on your trendline and select “Clone”, or simply place your mouse at your trendline, select “Ctrl” and dragging your mouse.

Well done! You have your short-term trendlines!
If you’d like my team and I to check on your trendlines, post your charts in our Facebook Group.
Here’s What You’ve Learnt Today
You’ve learnt of the 3 powerful reasons to using trendlines in swing trading – to identify potential turning points, spot diagonal support and resistance areas, and speed of a stock’s rally to save time and get your money to work harder.
You’ve also learnt how to draw trendlines using TradingView.
This is the start of becoming a successful and profitable swing trader. Come back next week for the other free tools you’ll need.
Here’s What You Can Do To Improve Your Trading Right Now:
#1 Register for our market outlook webinars by clicking here
#2 Join us in our Facebook Group as we can discuss the various ways of applying this by clicking here
#3 Never miss another market update; get it delivered to you via Telegram by clicking here
#4 Grab a front row seat and discover how you can expand your trading arsenal in our FREE courses (for a limited time only) by clicking here
Trade safe!
