
Have you ever found or received something rare? A typewriter or an old dollar note? What were your emotions? Delighted, honored, lucky, treasured?
Those emotions are elicited whenever I see this chart pattern. This chart pattern is rare and explosive in nature, often bringing in the money in a short period of time. What is this chart pattern? Why is it explosive?
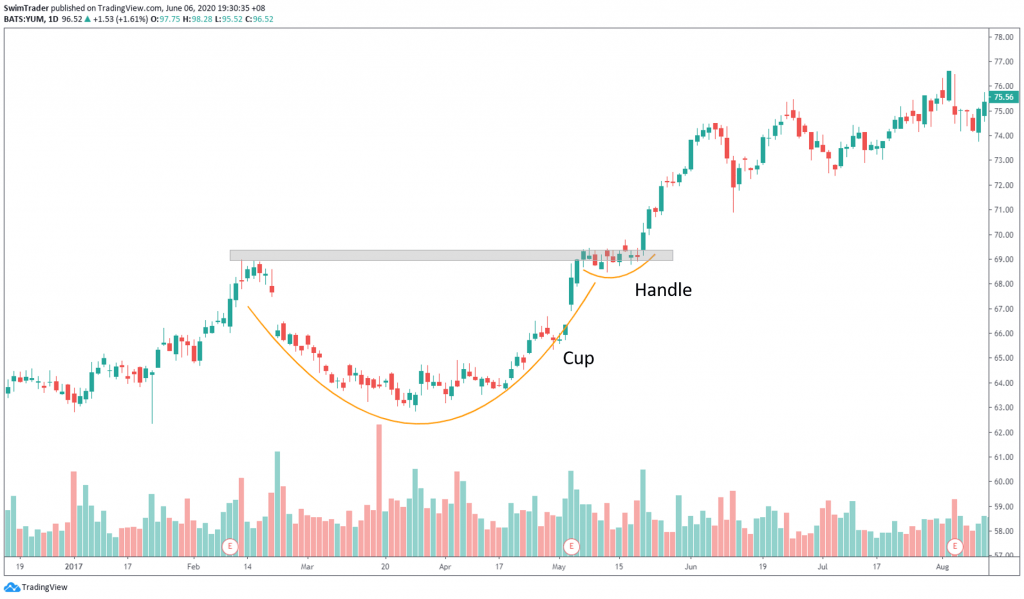
This is no other than the Cup and Handle chart pattern.
What’s The Cause Of The Cup And Handle Pattern?
This chart pattern is caused by profit taking in a bull market, followed by renewed bullishness.
Identifying The Cup And Handle Pattern
As the cup and handle pattern is caused by profit taking in a bull market, the prior trend must be up.
In other words, this is a continuation chart pattern. Therefore, this chart pattern is usually found in the middle of an uptrend.
The cup and handle pattern looks like 2 “rounding bottoms” stuck to each other. The 1st “rounding bottom” is larger (width and depth) while the 2nd is smaller.
What happens In the Cup And Handle?
Price has been climbing prior to this chart pattern. The traders who had bought early into the uptrend are sitting on profits. They decide to take their profits off the table (either partially or fully), resulting in a decline in price.
Those who have missed out the initial uptrend spot the decline in prices and feel that it is a worthwhile opportunity to go Long now. Price starts climbing and it hits a resistance level at the top of the cup (shown in grey in the diagrams).
The price retreats as traders sell, forming a shallow bottom (left part of the handle). Buying increases and the right side of the handle is formed. Traders spot this chart pattern and continue buying, resulting in a breakout in price, keeping the uptrend intact.
Spot It Right

Things to look out for:
- Uptrend
- Volume drops as price decreases at the start of the cup
- Volume increases as price increases towards the end of the cup
- High volume on the breakout of the handle
Show Me The Money
#1 Breakout


- Watch for price to break the resistance zone (shown in grey)
- Enter your position at the breakout
- Set your stop loss
- Set a profit target (based on the depth of the chart pattern)
#2 Pullback


- Watch for price to break the resistance zone (shown in grey)
- Wait for the price to pull back to the area near the zone and enter your position the next session
-
- If you are trading using the hourly chart, enter the trade an hour later
- If you are trading according to a daily chart, enter the trade on the next day
-
- Set your stop loss
- Set a profit target (based on the depth of the chart pattern)
Sit back, sip some tea, and let it dash towards your profit target.
Conclusion
Volume is extremely important. A breakout with low volume is a negative signal.
Watch for this pattern and you will be rewarded handsomely.
Here’s What You Can Do To Improve Your Trading Right Now:
#1 Register for our market outlook webinars by clicking here
#2 Join us in our Facebook Group as we can discuss the various ways of applying this by clicking here
#3 Never miss another market update; get it delivered to you via Telegram by clicking here
#4 Grab a front row seat and discover how you can expand your trading arsenal in our FREE courses (for a limited time only) by clicking here
Trade safe!
